Just in time for the end of the autumn vacations, the Lower Saxony Ministry of Culture has found a surprisingsolution to the ventilation problem: Great window hangers, even for self-printing, which are certainly effective in other German states as well.
We would never have thought that the solution would be so simple ... ;-).
If you still want to think about complex ideas, you are welcome to read on. To all those who doubt the existence of the virus or who want to know what the SARS-CoV2 virus looks like, we recommend this tweet from the DKFZ.
According to the current state of science (Fennelly, Lancet, 2020), tiny liquid droplets (aerosols) play a much greater role in the spread of respiratory tract infections than previously suspected. Too little ventilation increases the risk of disease, too much ventilation is harmful to the environment. With this participatory project for demand-oriented ventilation, we would therefore like to take the initiative to make the regular operation of our schools and universities in Corona times a little safer, while at the same time acknowledging climate protection. Even after the pandemic, targeted ventilation will help us to stop creeping fatigue processes in the classroom. After all, high CO2 levels also reduce students' attention and learning behaviour.
A CO2 measuring device belongs in every classroom and in every lecture hall, either purchased or, even better, homemade. Because when we build it ourselves, we learn a lot about physics, biology, chemistry, as well as computer science and can even integrate additional features that hardly any standard device offers. How about a web server, a cloud interface for an internal school competition on the topic of proper ventilation, or how to detect disinfectants in the air, or a pax counter to estimate the room occupancy?
With the Internet of Things we network, enable the exchange of information and can also take climate protection aspects into account. The IoT2 workshop encourages the educational system to help itself. We support you here with building instructions and scientific information. You can find more tips and replication projects throughout Germany on Guido Burger's Twitter.
Use the IoT2 workshop, get informed about the background, develop your own ideas and build your own. Not only in times of a pandemic (AI, SmartCity, spectrometer, level measurement of heavy rain, fine dust and much more) . But step by step:
The fourth issue of IBT's R&D News is now available.
Topics of the September issue of R&D News are 15 early students learning additive manufacturing at IBT and the opening of the Green Innovation Hub. Also, there is an overview of other current topics such as the published guide to climate-neutral home construction, the conversion of the technical center for the research area of remanufacturing, and the promotion of doctoral studies at the IBT by the junior researcher fund of Trier University of Applied Sciences.
Click here for the R&D news.
Where does indoor carbon dioxide come from?
Correct, it comes from the exhaled air of people who are indoors. Each person exhales about 8 liters of air per minute, which has been in intensive contact with the lung tissue. The air exhaled therefore contains CO2 (4 % = 40,000 ppm) as well as tiny liquid droplets (aerosols), which due to their size can float in the air for a long time. If the respective person is infected with the virus, these droplets also contain virus particles. At aerosol sinking rates of a few meters per hour (source) and a decrease in biological virus infection activity with a half-life of approx. 2.7 hours (source), the room air remains polluted for a longer period of time. If a healthy person inhales these contaminated droplets and the number of virus particles contained in them exceeds a minimum infection dose, the disease is transmitted. Over 200 scientists recently appealed to the WHO to take airborne transmission of SARS-CoV-2 more seriously (Morawska & Milton, 2020). CO2 measurement offers a cost-effective solution for assessing the current risk from potentially infectious aerosols.
If we are in a room with several people, measuring the CO2 concentration provides a measure of the percentage of air we breathe in that consists of air already exhaled by other people. The mass balance shows that a measured CO2 concentration of approx. 1200 ppm (parts per million) means that almost 2% of the air in the room has already had lung contact at least once [Rudnick&Milton, 2003]. One can clearly see that every 50th breath a person takes in this room consists of air that has already been exhaled. We do not want to speculate about the resulting concrete corona infection risk, it depends on various factors that are currently still being intensively researched. The MPI Chemistry in Mainz offers an interactive risk calculator for this purpose. One risk factor is certainly the number of other people in the same room, the local pandemic event and the air flow. The problem of how many people are actually in the room will be investigated at the end of this manual (WiFi-Pax-Counter). All in all, of course, the following applies: If none of the people in the room are infected, there is no risk of infection even at high concentrations.
How to prevent the risk of infection?
From the preliminary considerations it is clear, however, that good ventilation of the rooms reduces the risk. Irrespective of this, a good room climate also promotes the ability to concentrate. Good ventilation should therefore be a matter of course when a large group of people is gathered. The Federal Environment Agency has drawn up general guidelines on the "Health assessment of carbon dioxide in indoor air" and a special statement SARS-CoV-2, which we will use as a guide in the following. According to these guidelines, a concentration of < 1000 ppm is hygienically safe. A concentration between 1000 and 2000 ppm is classified by the guideline as questionable and everything above this is considered unacceptable. CO2 is also an important indicator in the DGHK statement on prevention in schools. The UBA working group on ventilation recommends the use of CO2 traffic lights. The DGVU (accident insurance fund) goes even further and pleads for a target value of 700 ppm in classrooms in times of epidemics. The latest findings are summarized in the UBA guidebook "Ventilation in Schools" (15.10.20), which was prepared for the KMK.
Ventilation means not only air exchange, but also heat loss in winter. A sustainable strategy should also take this effect into account. If, as in most schools, there is no modern air-conditioning technology with heat exchanger, the only way to avoid this is to monitor the CO2 and to ventilate manually on a needs-oriented or regular basis.
At this point we would also like to point out a connection between humidity and possible risk of infection:
A research team at the Leibniz Institute for Tropospheric Research therefore recommends a relative humidity of 40-60% indoors. Most CO2 traffic lights also indicate the real humidity of the indoor air. Due to frequent ventilation in winter, this will tend to be too low. An increase can be achieved e.g. by many plants on the windowsill or a bowl of water on the radiator.
The above considerations apply to all interiors where people gather. However, the special attention of the IoT workshop is focused on the classrooms in our schools. Here, there is an urgent need for action, as many of the classic ventilation recommendations ("cross ventilation every x minutes") are often difficult to implement in practice for structural reasons. Empirical studies (Unfallkasse NRW, Fraunhofer IBP, NLGA, again Unfallkasse NRW) are therefore often based on the upper limit values of the UBA and try to model the situation using ventilation tools (Unfallkasse NRW, Fraunhofer WKI) or apps.
Here, a control of the ventilation success and, if necessary, individual adjustment of the time interval / ventilation duration would be useful. Tilt ventilation is virtually ineffective and only leads to an increased heating requirement of the school. If the colder season comes, well-intentioned recommendations also reach psychological limits. In the research project REGENA we were able to determine no one in the room wants to freeze unnecessarily - intelligent measurement instead of time control is essential for user acceptance.
How can we increase user acceptance at school?
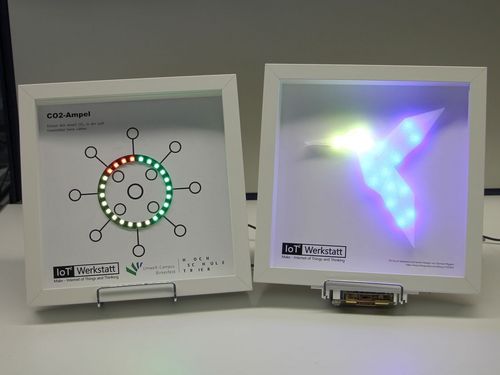
Small interventions, such as the above window hanger from Lower Saxony, can actually draw attention to the ventilation process. But it would be even better if the underlying laws of nature were clearly addressed in class as part of a self-building project. Teachers from MINT (mathematics, natural sciences, computer science, technology) can get involved, as well as colleagues from the arts or ethics. Why not an individually designed traffic light in the school's design?
Building your own CO2-monitoring traffic light for your own classroom creates and promotes creativity and gives everyone involved the feeling that they are contributing to risk avoidance and the protection of society. In the following we will add more links to the MINT backgrounds of COVID-19. We are happy about every hint to suitable sources.
In the following we want to build an IoT application to quantify the risk of infection in indoor spaces and visualize it in the form of a risk traffic light. If the traffic light shows yellow or red, it is time to open the windows or leave the room. (Of course, aerosols will eventually settle due to gravity, a non-ventilated room with "bad air from yesterday" may be harmless, but of course we don't want to take that chance).
For this we need a sensor for the CO2 concentration. A typical measuring method for carbon dioxide is infrared absorption. There are many different models on the market, some with analog output, so that a connection to the Octopus can be easily made with the AnalogRead device. For display purposes, the Maker requirement offers various options. Whether traffic light, numerical value, or text output: the graphic blocks of the IoT2 workshop offer maximum flexibility in programming. There are practically no limits to your own creativity.
Only a few steps are necessary to build. Here we show you step by step how to do it.
Note: Our self-construction ideas are based on the hardware of theIoT-Octopus or theAdafruit Feather HUZZAH ESP8266. Our IoT workshop also offers the ideal platform for all other esp8266 based systems (NodeMCU, Wemos D1). The necessary circuit diagram of the Octopus can be found here. Unfortunately, the world market for components is now almost empty. Guido Burger offers a DIY-universal circuit board and kits that make use of components that are still available. Make from the Heise publishing house also gives away such boards.
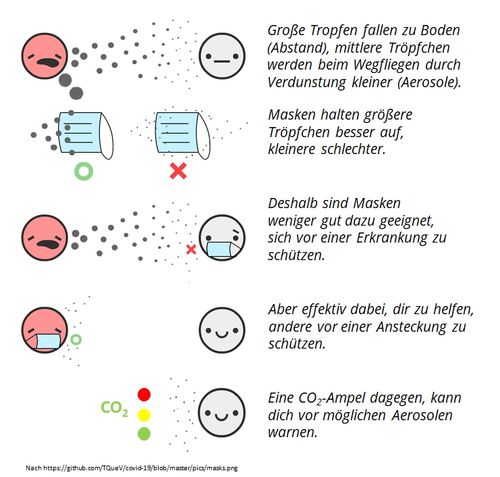
Correct, these measures help us to reduce the risk of infection and thus reduce the reproduction rate R, which is so important for the future course of the pandemic. The number R is a measure of how many more people an infected person will infect. If R>1, we see an exponential course of disease in society and must fear stronger measures (school closures). Experts speak of a "hammer and dance" strategy that is possible for years. Background information and various scenarios can be found in the lovingly illustrated interactive learning unit by Marcel Salathé and Nicky Case, on whose idea the adjacent illustration is also based.
The goal must be to push the number R below 1, i.e. to ensure that an infected person infects less than one other person in the course of his illness. Wherever distance rules and mouth-and-nose covers are difficult to implement (e.g. in school lessons), we need another tool for this.
And this is where monitoring of the CO2-content in indoor air comes in handy.
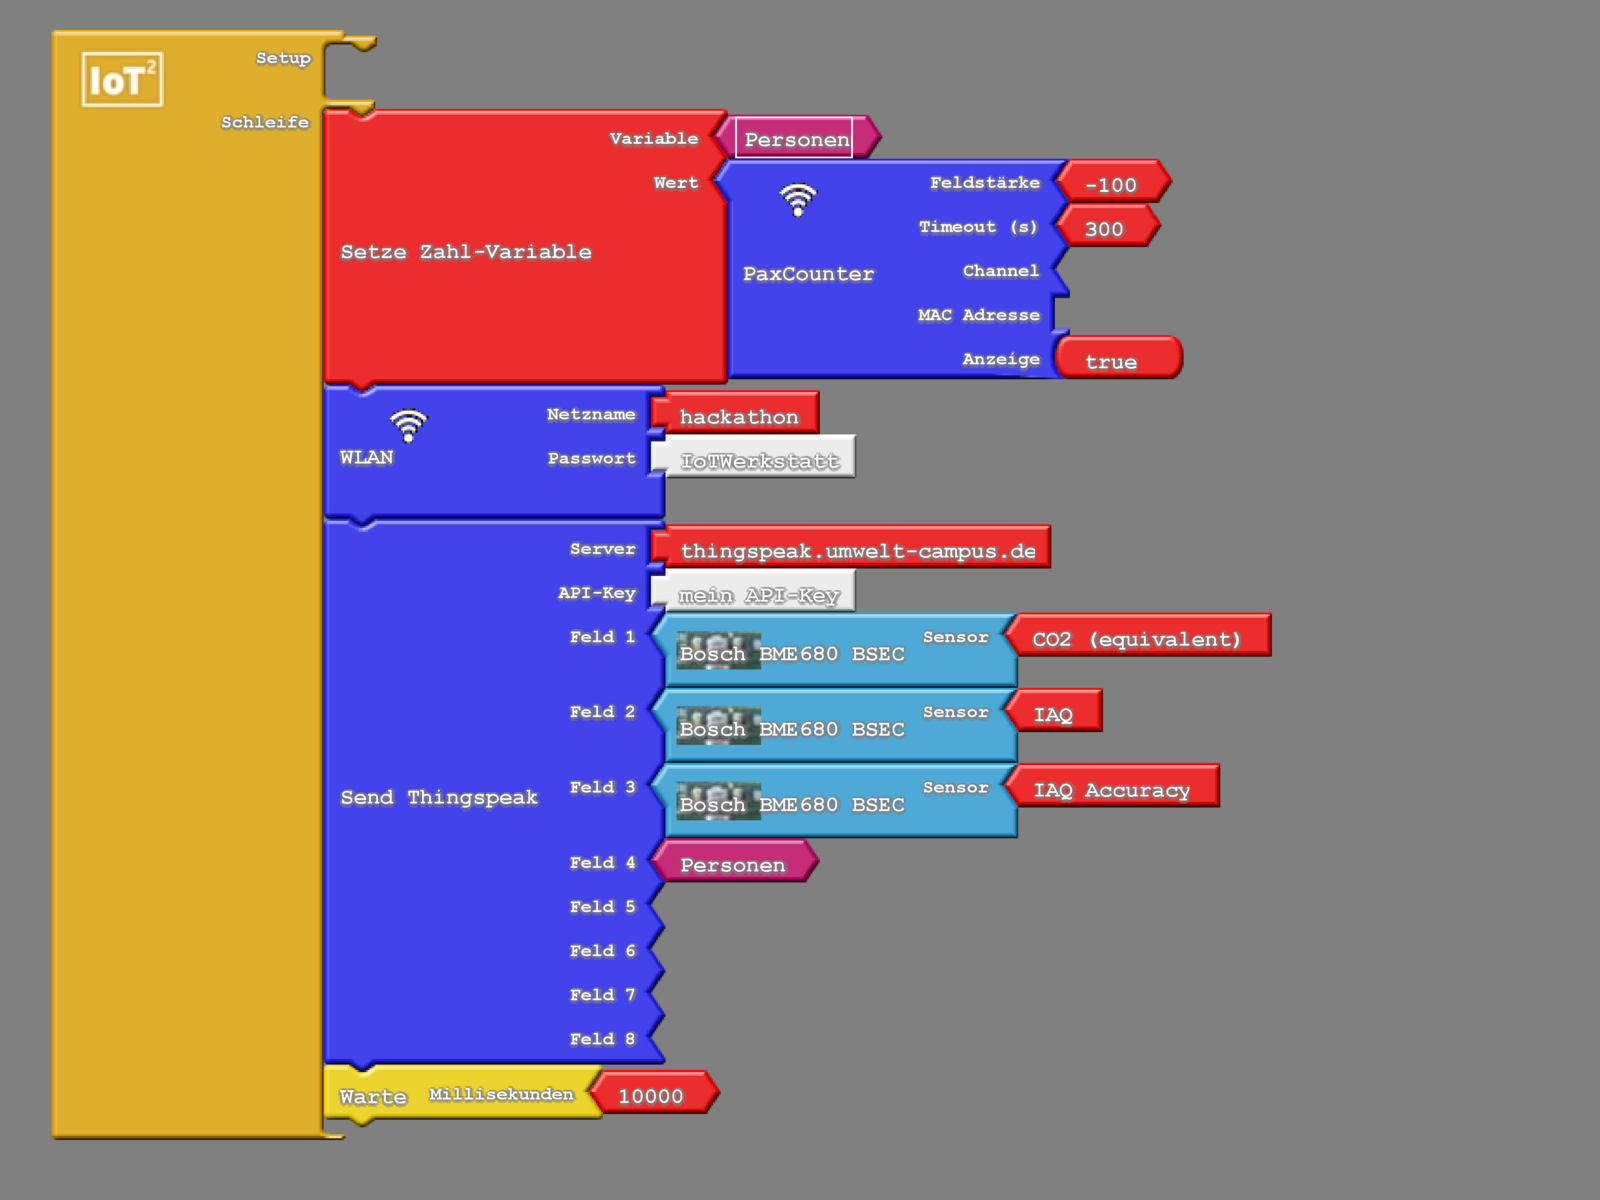
Owners of an Octopus with Bosch BME 680 environmental sensor can use the built-in VOC sensor (volatile organic compounds, volatile organic components) to estimate CO2 (CO2 equivalent).
The functional principle: During gas exchange in the lungs, not only CO2 and oxygen are involved, but also other blood components are released into the air. These organic components lead to an increased VOC concentration in the exhaled air. A software sensor in the BSEC library of the BME 680 converts these into equivalent CO2 concentrations. Thus, we only measure the CO2 exhaled by a person. This software sensor could not detect the CO2 of a fizzy bottle. An effect that fits perfectly for our current application. However, the disadvantages should not be concealed here: Also other VOC sources (disinfectants, alcohol, bad breath, formaldehyde) falsify the measurement. So the alarm limits may have to be adjusted a little bit. More information and background information on VOCs in schools, e.g. in the guidelines for indoor hygiene in school buildings of the Federal Environment Agency.
Note: The software sensor needs some time for self-calibration. The status of the calibration is displayed in the sensor channel "IAQ Accuracy". (Accuracy 0: Sensor not stable until Accuracy 3: Sensor successfully calibrated). For more information click here. In any case, such a software sensor is a great example for the use of modeling and machine learning.
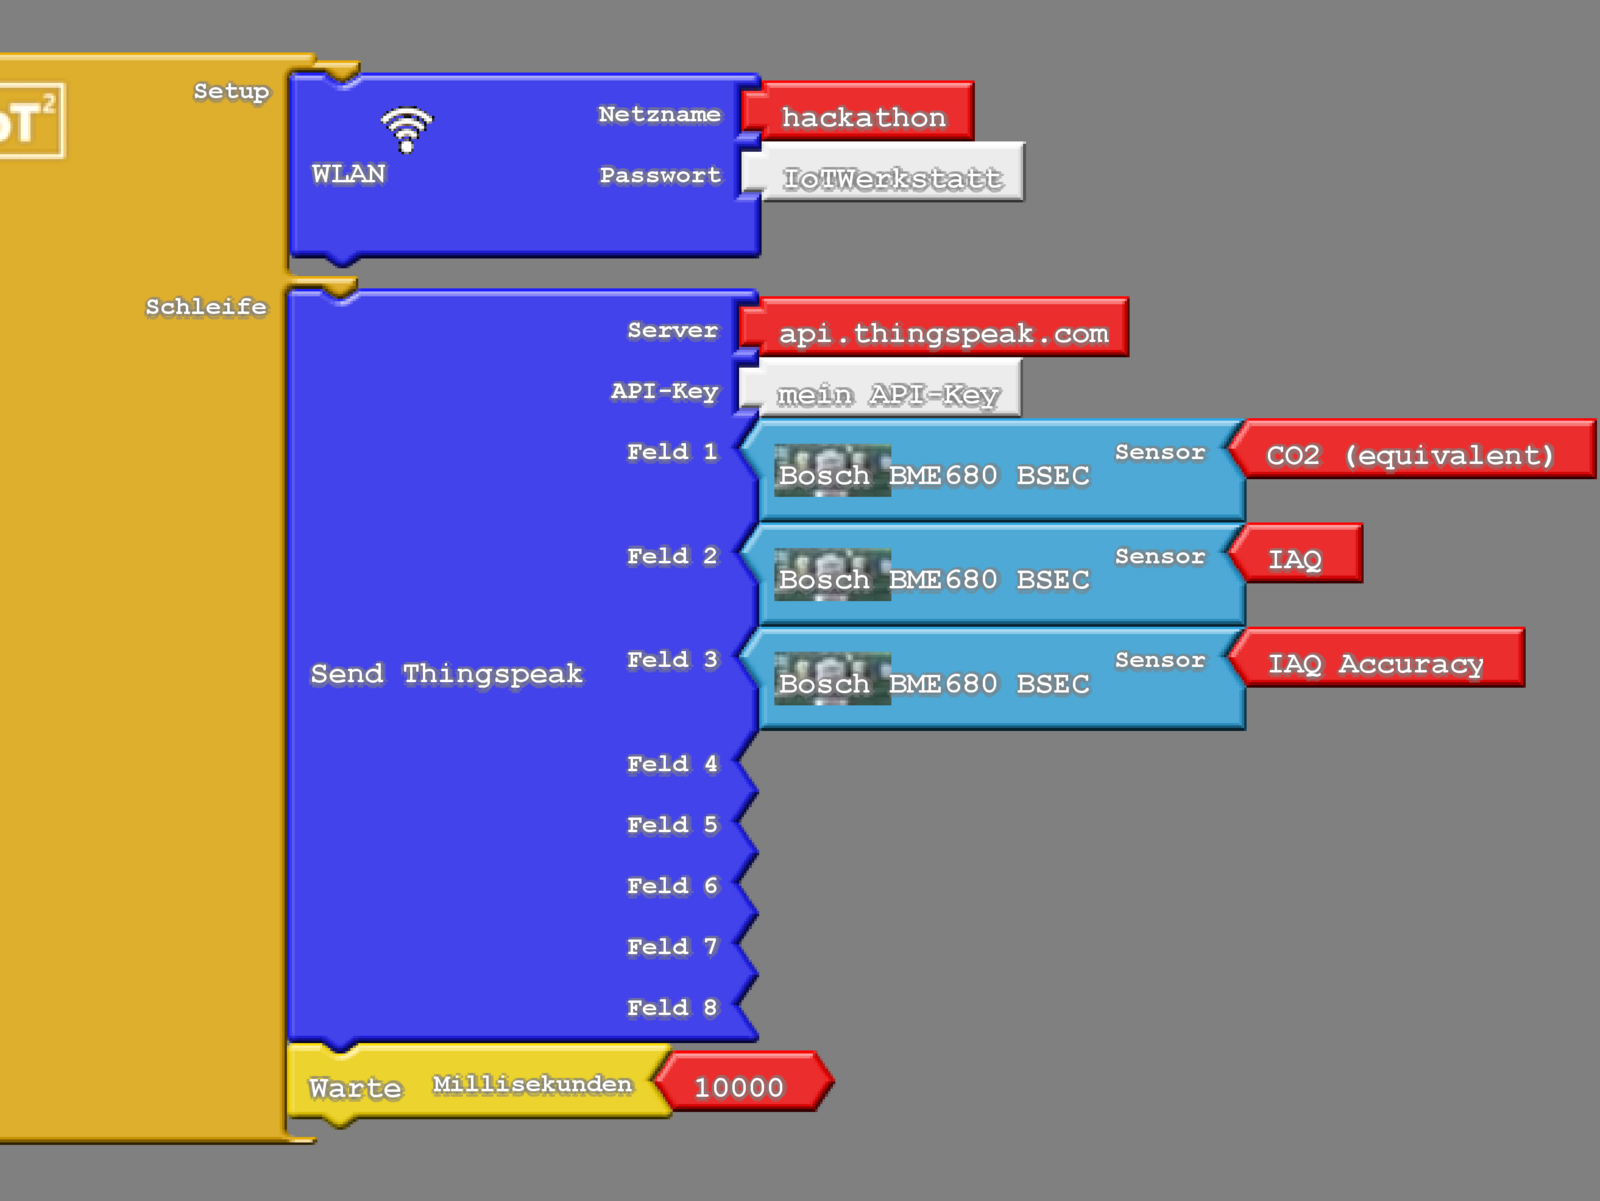
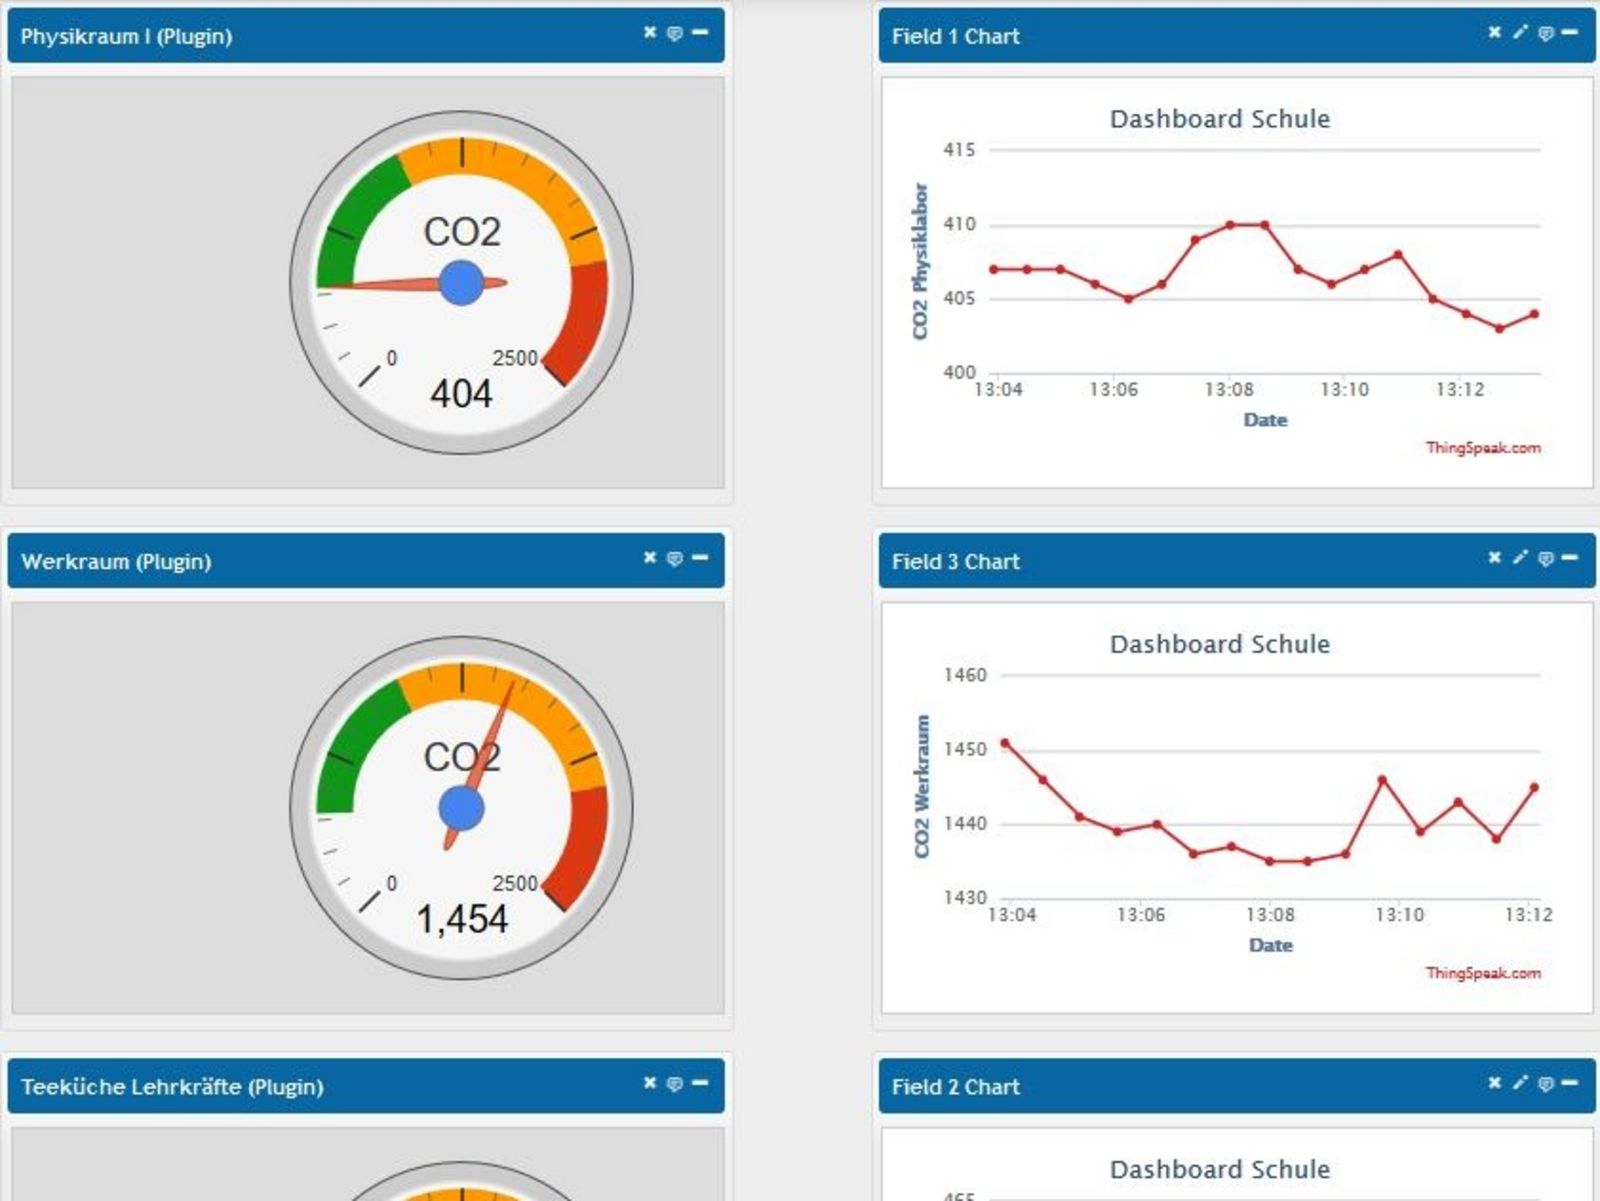
Thanks to IoT Superblocks, we can make the measurement results visible on the Internet. Only within the school, or even worldwide. Simply log in / visualize via WLAN to the Internet and the Thingspeak data platform. The history of each room can be viewed at any time, so there is nothing to prevent ventilation competition from a technical point of view. The Thingspeak server from Mathworks even allows the use of Matlab for statistical analysis or for modeling predictions (more about mathematical models and Matlab here). Even graphical elements (gauge) can be integrated. Curious? Everything else here.
And as a possible outlook: If there were a corresponding infrastructure, our traffic light could even query the current infection situation in our district. We could thus adapt the warning limits to the current local risk.
The CO2 concentration alone says nothing about the risk of infection. Of course, the number of people in a room is also an important parameter. If we ourselves are the sole source of CO2 (individual office), there is no hygienic risk even at high concentrations. But thanks to Pax-Counter we even know the occupancy of the individual rooms. A Pax-Counter counts the Smartphones in the room based on the MAC address of the WLAN interface (more about the Pax-Counter here).
You are leaving the official website of Trier University of Applied Sciences